Research
Knowledge gaps about ILD-based feedback
IJsbrand Leertouwer, in collaboration with Jeroen Vermunt, Angelique Cramer, and myself has written a paper on the various asssumptions - explicit and implicit - made when one gives participants feedback based on their collected ecological momentary assessment data. In it we explify various of these assumptions, and formalize them as far as we can in equations (spoiler - we do not get far with that) to identify important knowledge gaps with respect to all this.
For example, one probably accurate assumption is "Remembered experiences are an unrepresentative incomplete subset of the experiencing self", but if you try to formalize this it turns out we have very little concrete knowledge on how this subset is taken, or in what way exactly it is incomplete. Making such a lack of knowledge explicit is useful to realize we need people to actually do studies on these things, and that is the point of this paper.
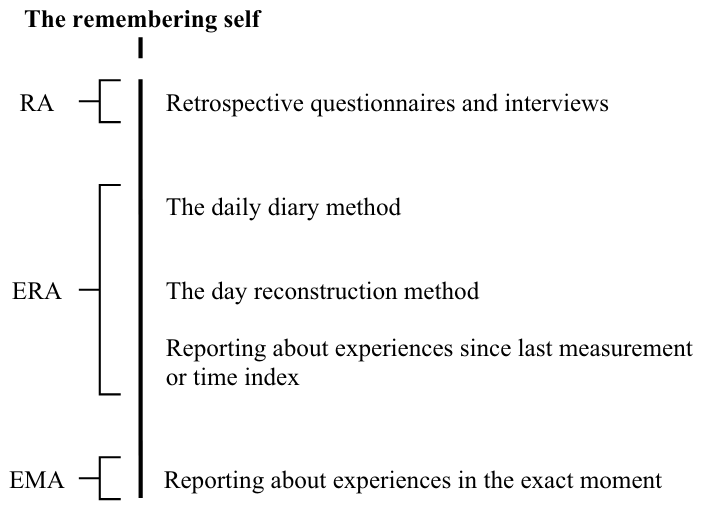
Also, IJsbrand coins the term 'ecological retrospective assessment' (ERA) in this paper. For example, when you ask participants 'how did you feel in the last three hours' rather than how they are feeling right now, that would classify as ERA, rather than ecological momentary assessment (EMA).
What Personality Items Measure
Pia Andresen, in collaboration with Ellen Hamaker and myself, has written a paper about what statistics personality items measure. For example, an item like "Get stressed easily" seems to attempt to measure some regression coefficient of life events on stress (the 'get stressed' part); which then has to be compared to some standard, perhaps whether this coefficient is relatively high compared to other people (the 'easily' part). We endeavored to code such things for 300 items, and find consensus about this among the three of us. It required multiple rounds of coding and lots of discussion. It was not an easy job, and it was very fun.
Pia evaluated what different kind of statistics are measured by different items, and finds some striking results which you can read all about in the paper. More generally I learned that seemingly very simple items can measure very complex and layered things (like the get stressed easily example). At the same time the items are often very vague and multi-interpretable. This work has left me even more excited to learn more about what people are doing when they are filling out questionnaires :).
Dealing with the ILD Night Gap
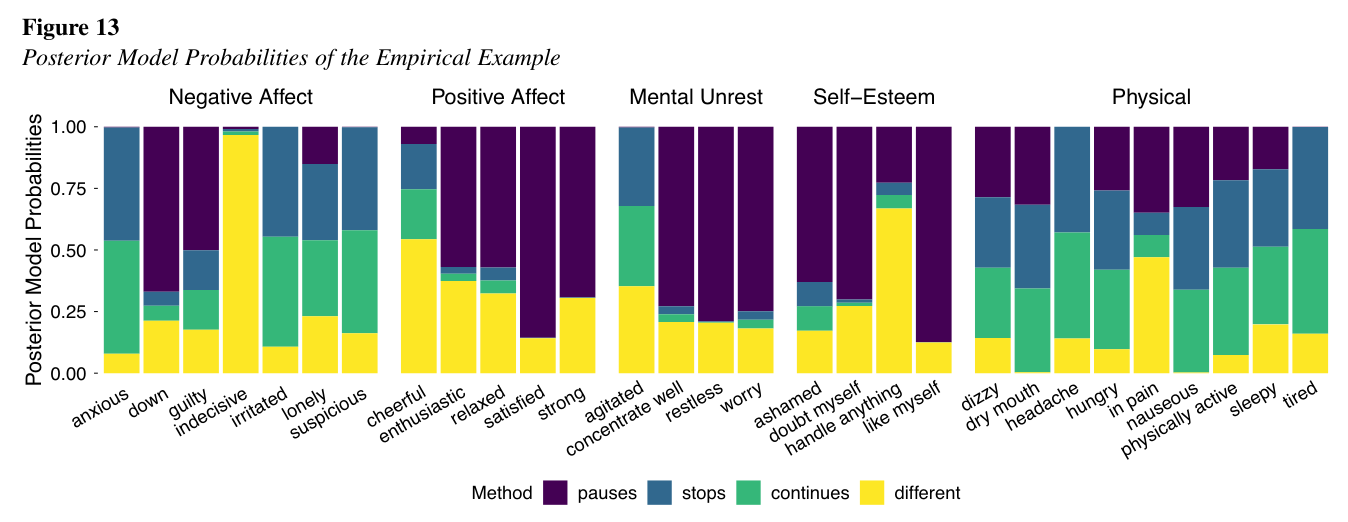
Sophie Berkhout, in collaboration with Ellen Hamaker and myself, has written a paper about the nightgap problem in intensive longitudinal research. The night gap is the gap that is left during the night in between bouts of experience sampling during the day, because people can't fill out questionnaires during their sleep. This gap needs to be accounted for during most analyses of intensive longitudinal data, because the interpretation of their results relies on equidistant repeated measures (equidistant in time).
There are a couple of common ways to deal with it, but all of these ways have theoretical implications of what happens to the psychological variable of interest during sleep. Specifically, whether it continues during sleep in the same way as during the day, whether it 'freezes' (pauzes) until morning, or it stops and starts again in the morning. Sophie has added a fourth option, has done proof of principle simulations for it in Mplus and Stan. She also applied each of the approaches to real data, and tested which approach fitted the data best for various different variables. Spoiler: It turns out it depends on the variable!
A Within/Between Problem Primer
I've written a primer on the "Within/Between Problem" in psychology - the problem of (not) separating within-person and between-person variance:
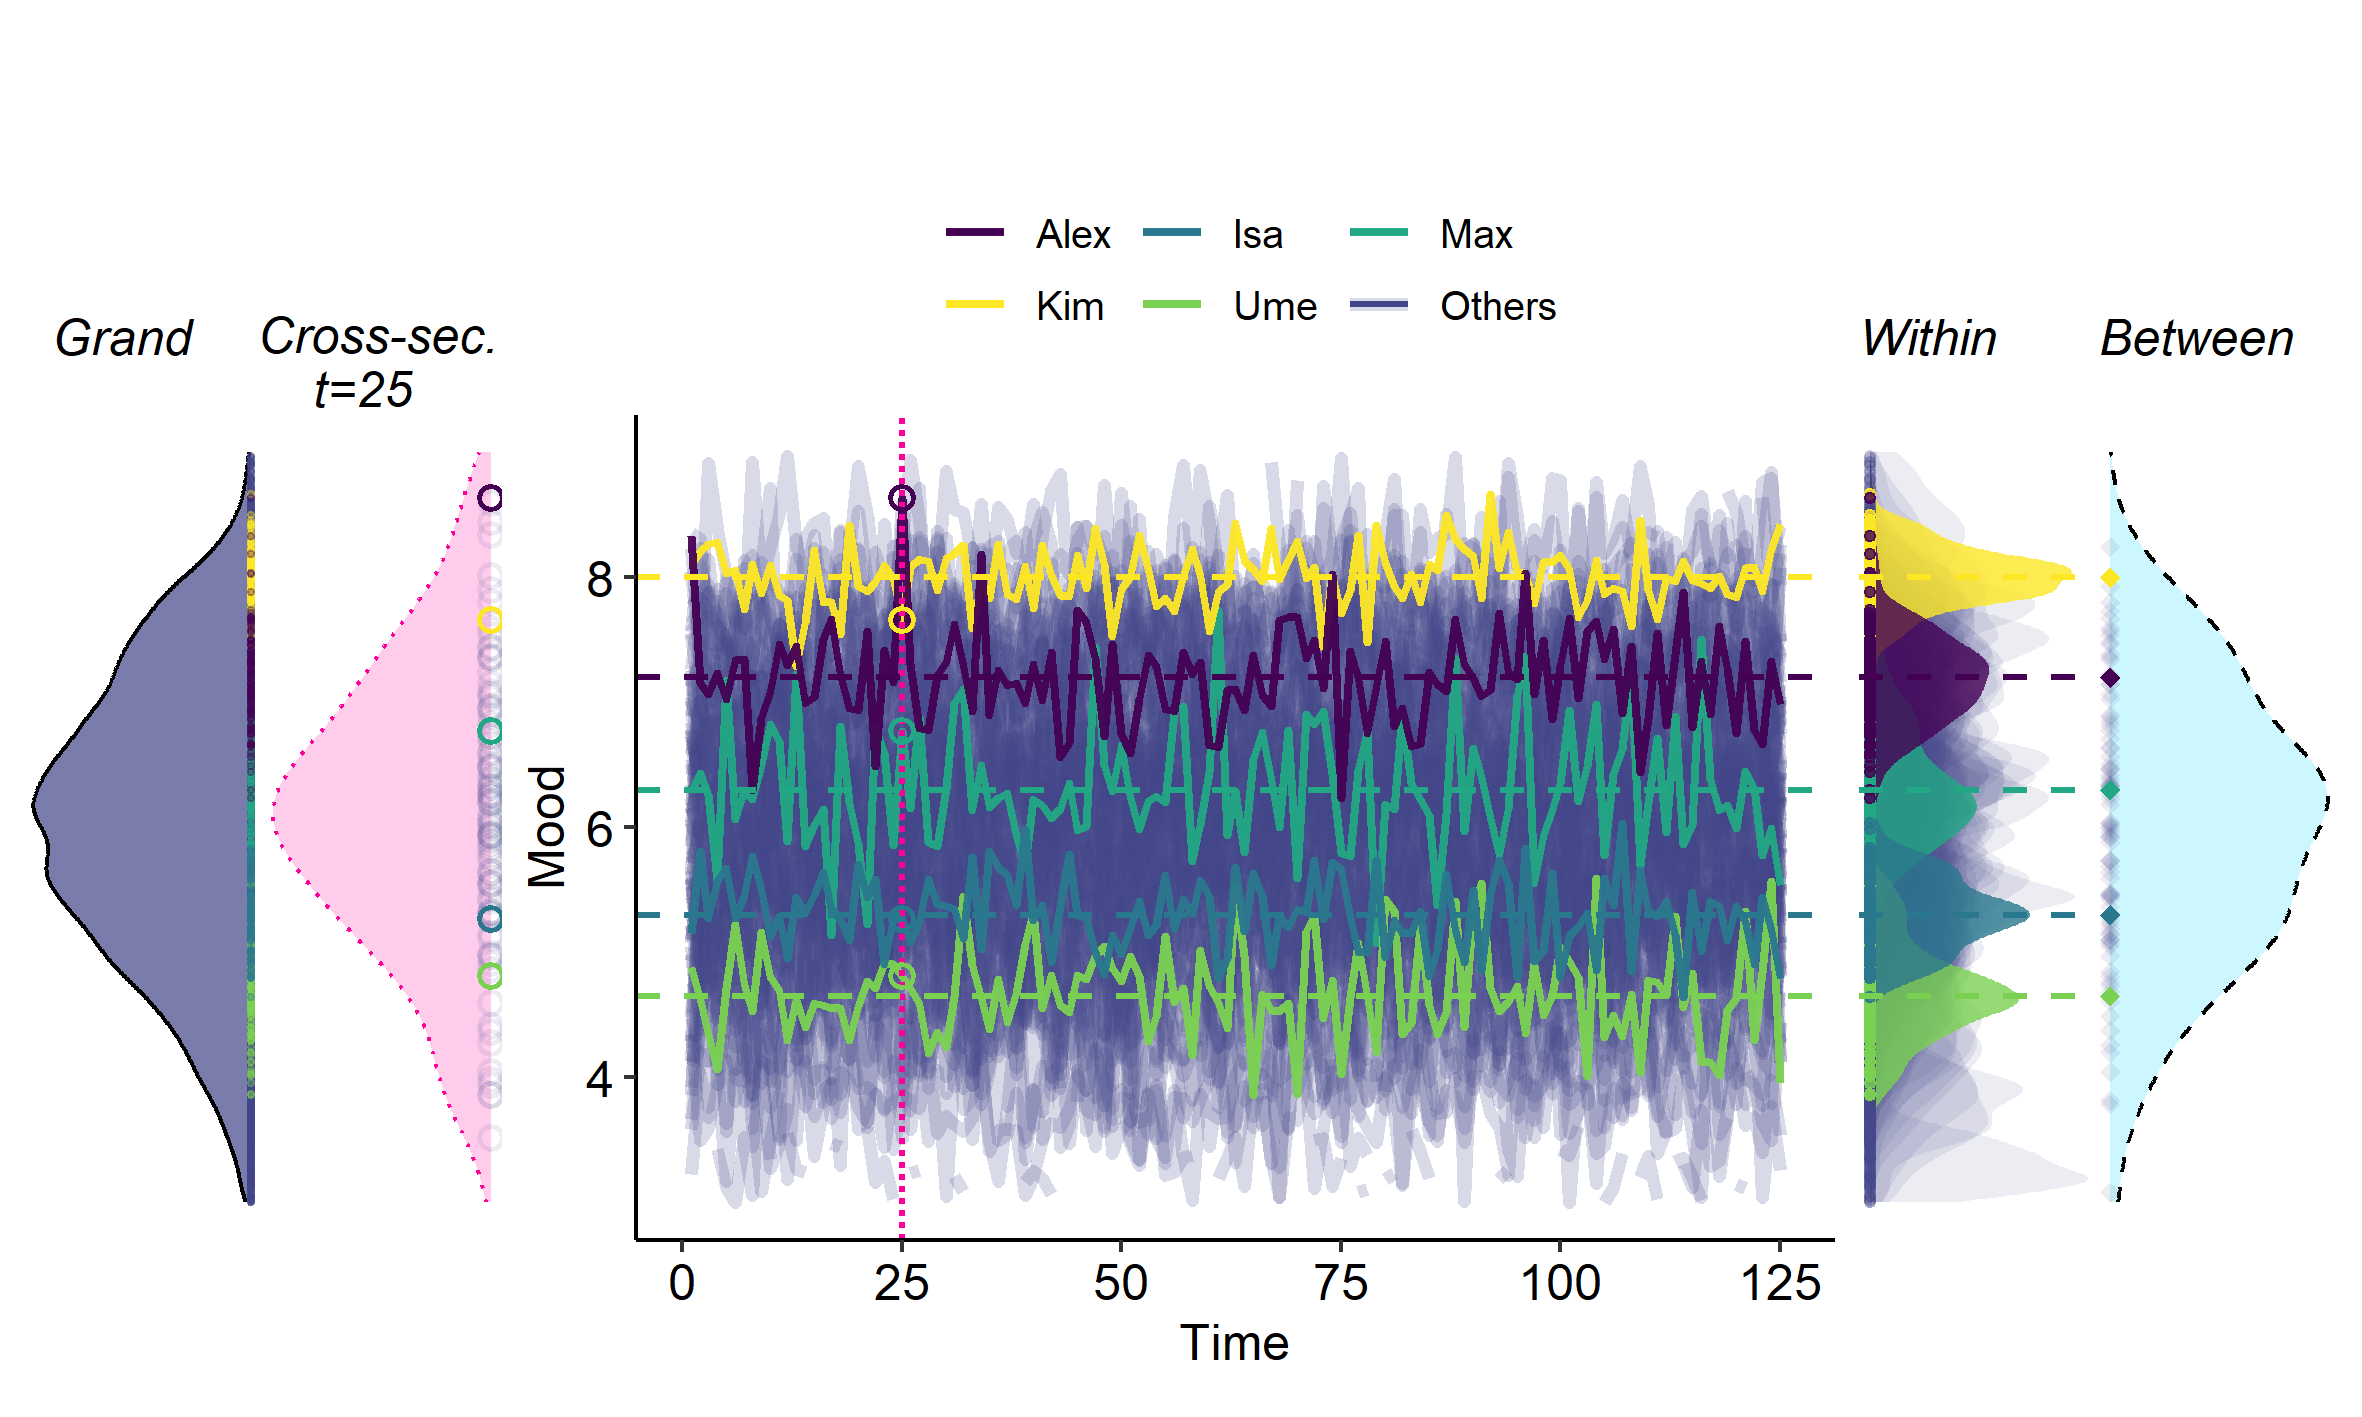
Whenever we measure a psychological variable for multiple persons we typically capture both stable differences between persons, resulting in ``between-person variance'', and fluctuations within a person over time, resulting in ``within-person variance''. Both types of variance are of key interest to psychology: Stable differences between persons are the main interest in psychological research on, for example, traits and risk factors. Variation in variables over time are the main interest in studies that focus on psychological processes, change, and development. Failing to distinguishing between these sources of variance in our data can quickly result in wrong conclusions about both types of variation.
This is an essential problem for all studies with data from multiple persons – cross-sectional and longitudinal. However, it can be hard to wrap your head around. Hence, I provide an entry-level review of the problem: I elucidate related jargon, the potential consequences of the problem, and various practical solutions to it. To illustrate the problem, I provide an online app in which researchers can change various settings to see how they influence the conclusions of analyses (see post below).
The pre-print is available: here
A Within/Between Problem App
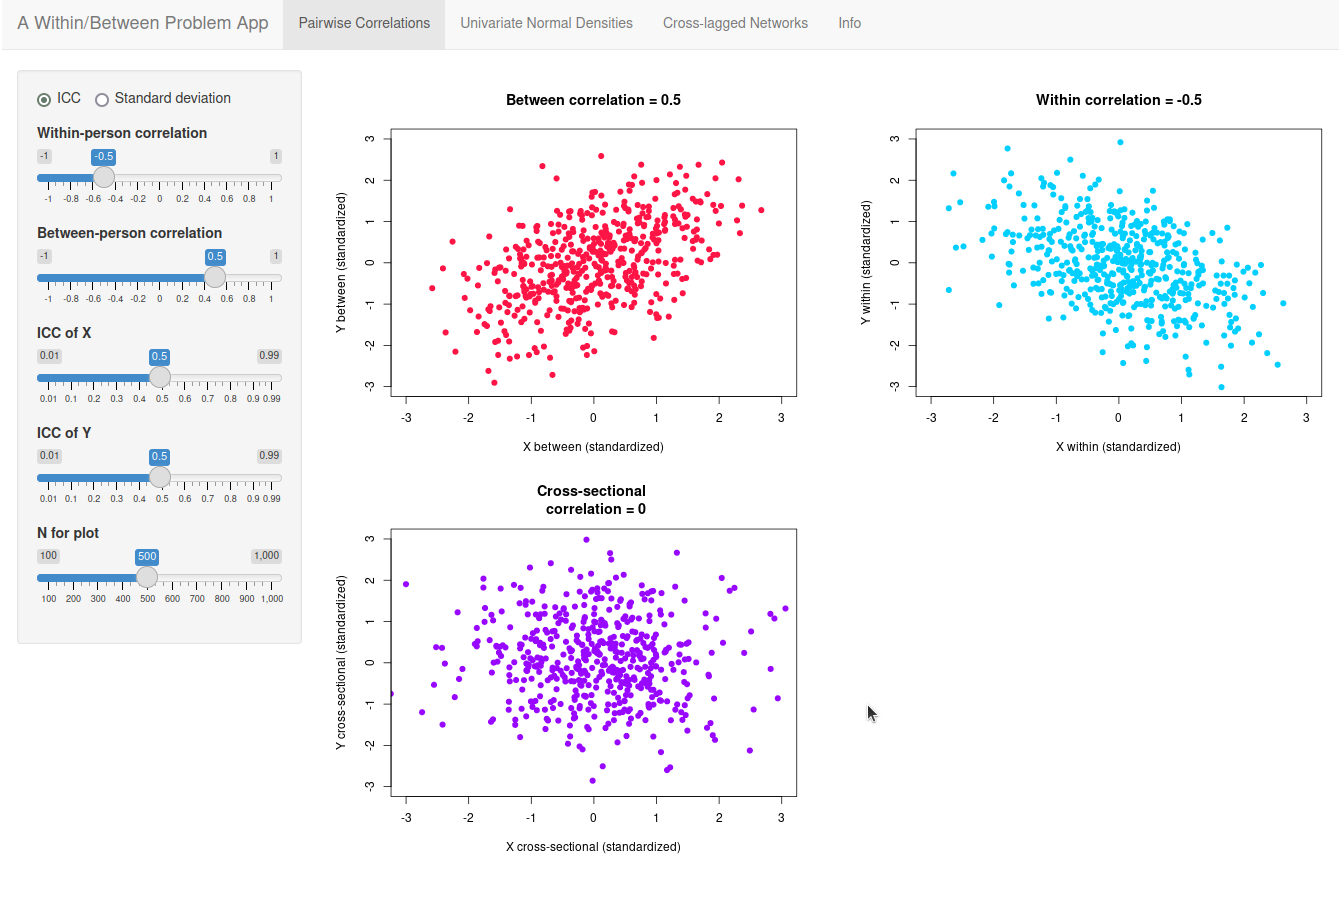
I've made an app to illustrate how within-person and between-person variance blends in different cross-sectional contexts: For the (normal) distribution of a single variable, for the correlation between two variables, and for a network of different variables. You can try it out online here.
Multilevel Dynamic Twin Modeling
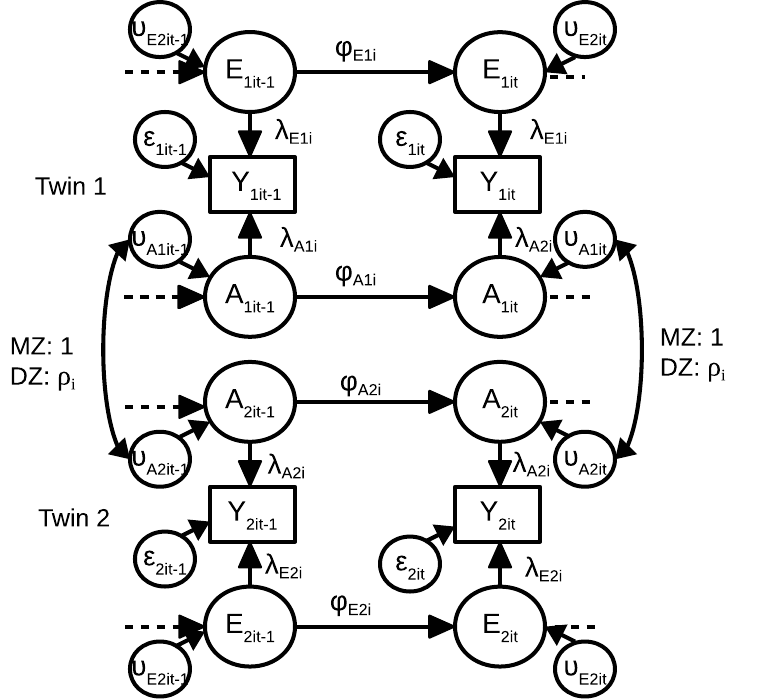
In this open access paper published in SEM I describe a multilevel dynamic twin model, together with Yao Zheng and Conor Dolan. We discuss the specification and interpretation of the model, how it is related to the genetic simplex model and the IfACE model, and we discuss the concept of intra-individual heritability. All three models are used to model intraindividual differences in genetic and environmental effects for a certain phenotype. All three models (with varying model assumptions) can be used to obtain estimates of intra-individual heritability, the proportion of intra-individual variance in phenotypes that is a result of intra-individual variance in genetic effects. The multilevel model can be used to additionally study how these dynamics differ from person to person. We apply the model to empirical data that was kindly shared by Marieke Wichers, Nele Jacobs, Jim van Os, Catherine Derom, and Evert Thiery.
Supplemental Materials
Measurement Error and Person-Specific Reliability in Multilevel VAR models
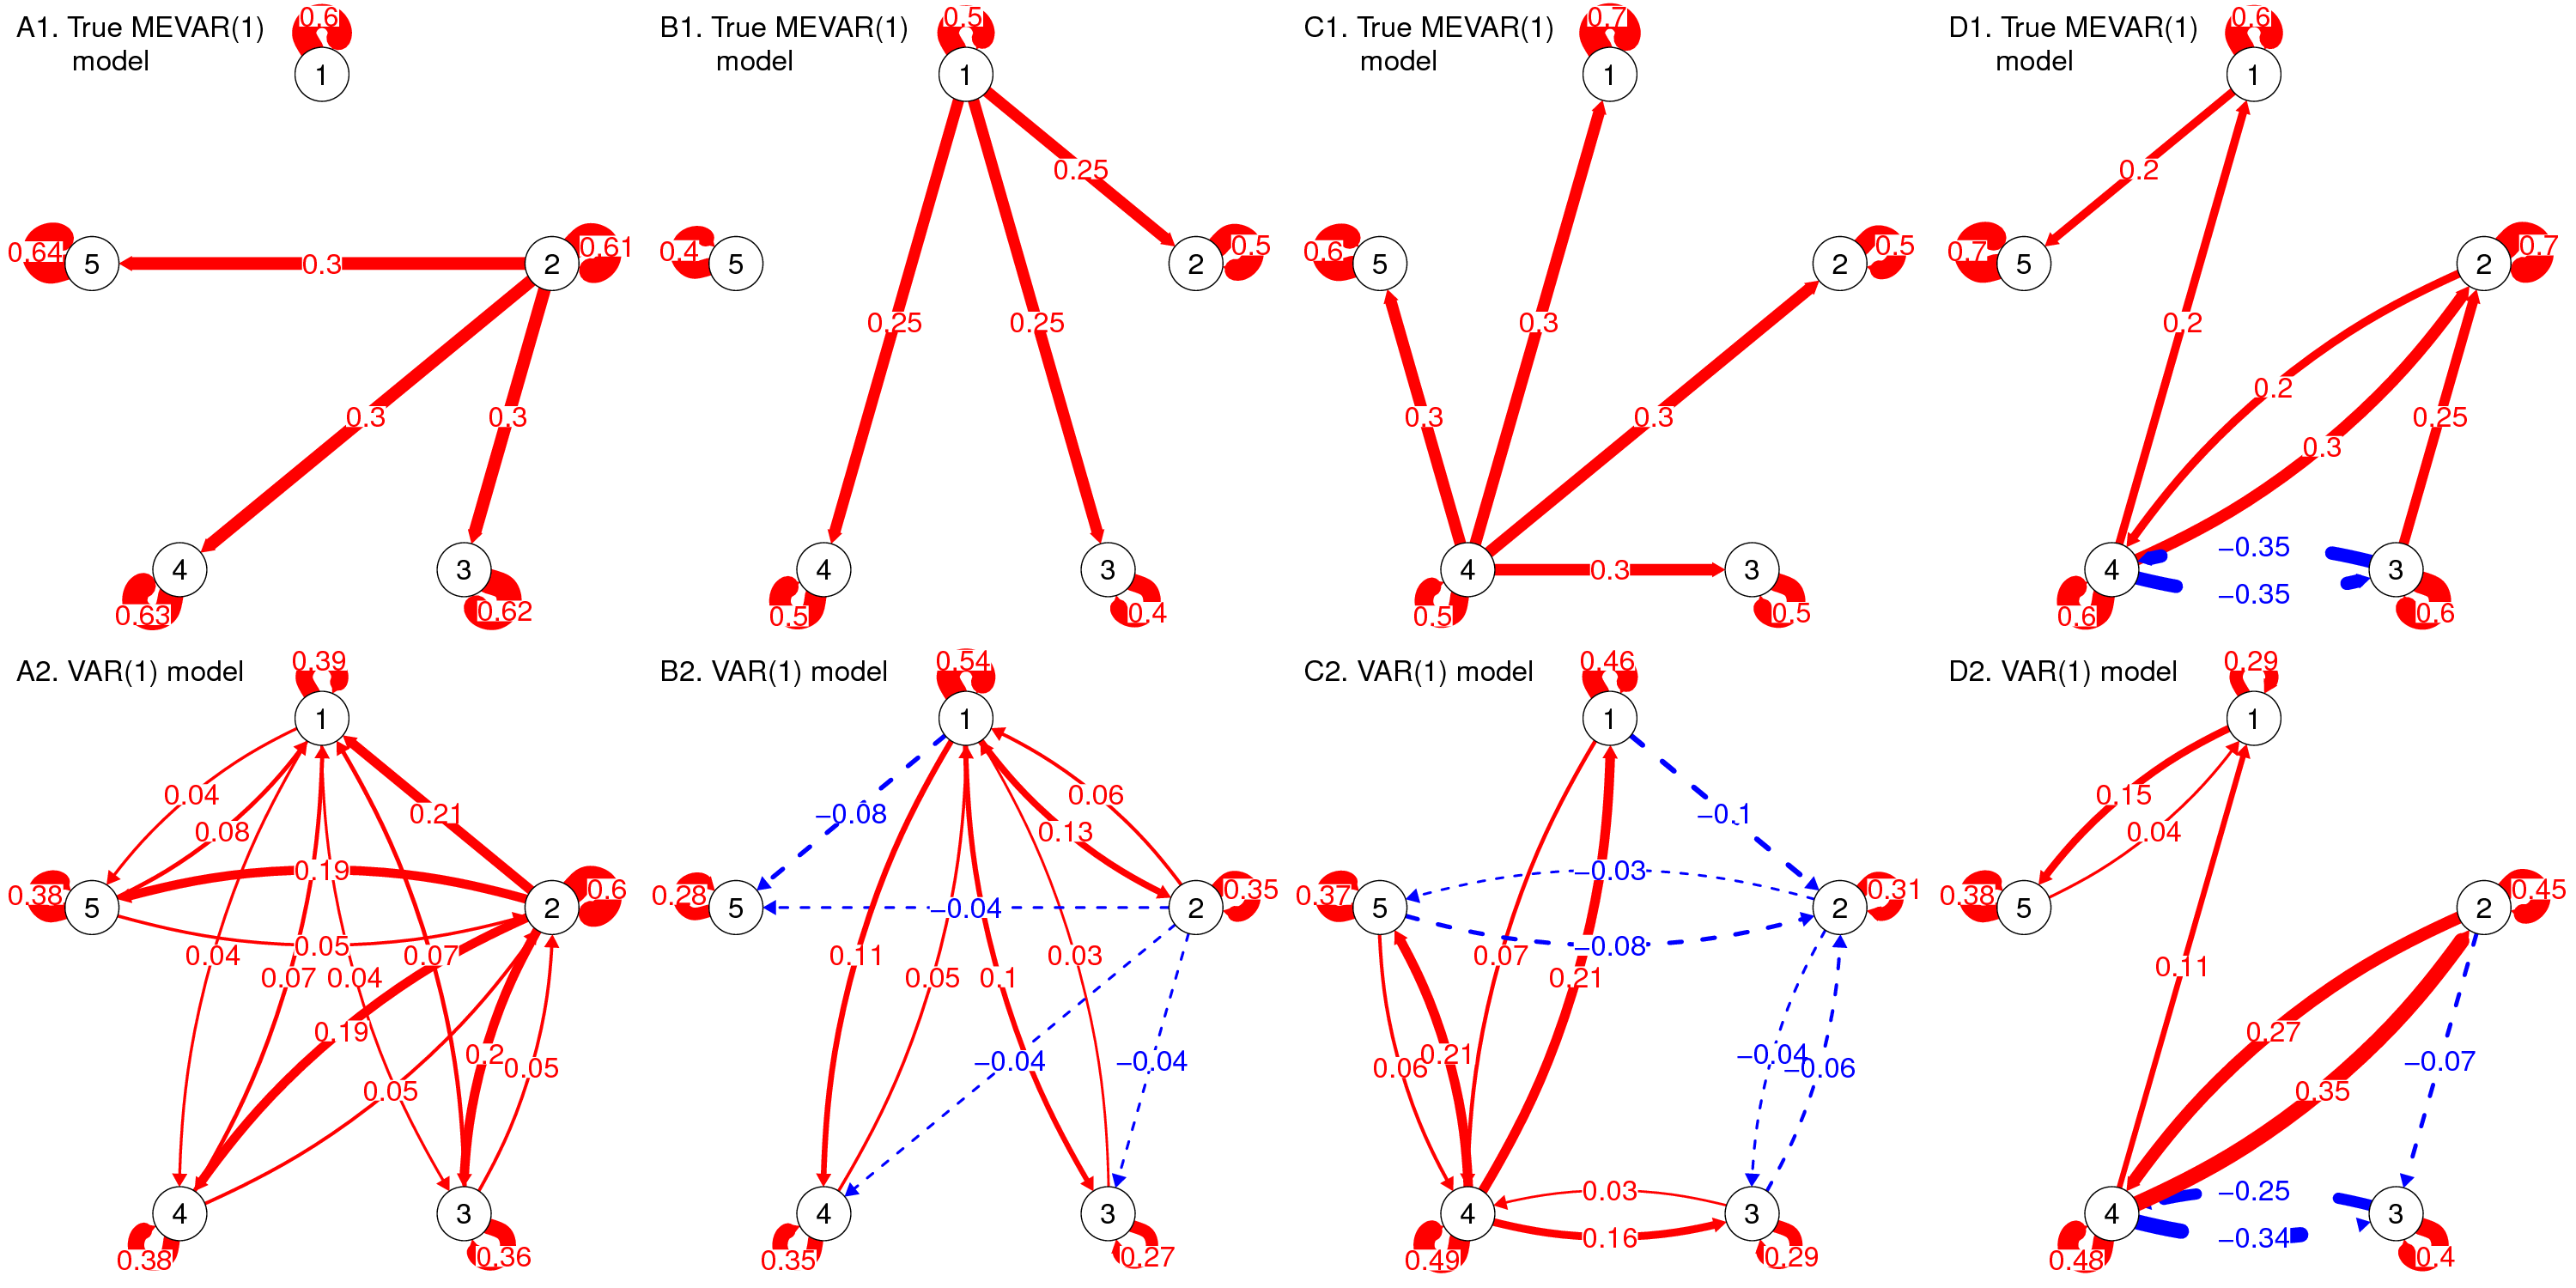
Both n=1 and Multilevel VAR models disregard that there may be measurement error, or other occasion-specific fluctuations in the observed scores. In work together with Ellen Hamaker I discuss how this can result in severe bias in both the autoregressive and cross-lagged effects: (Strong) spurious effects may arise, effects may dissappear, and effects that are actually positive may be estimated as negative and vice versa (for examples, see the figure below).
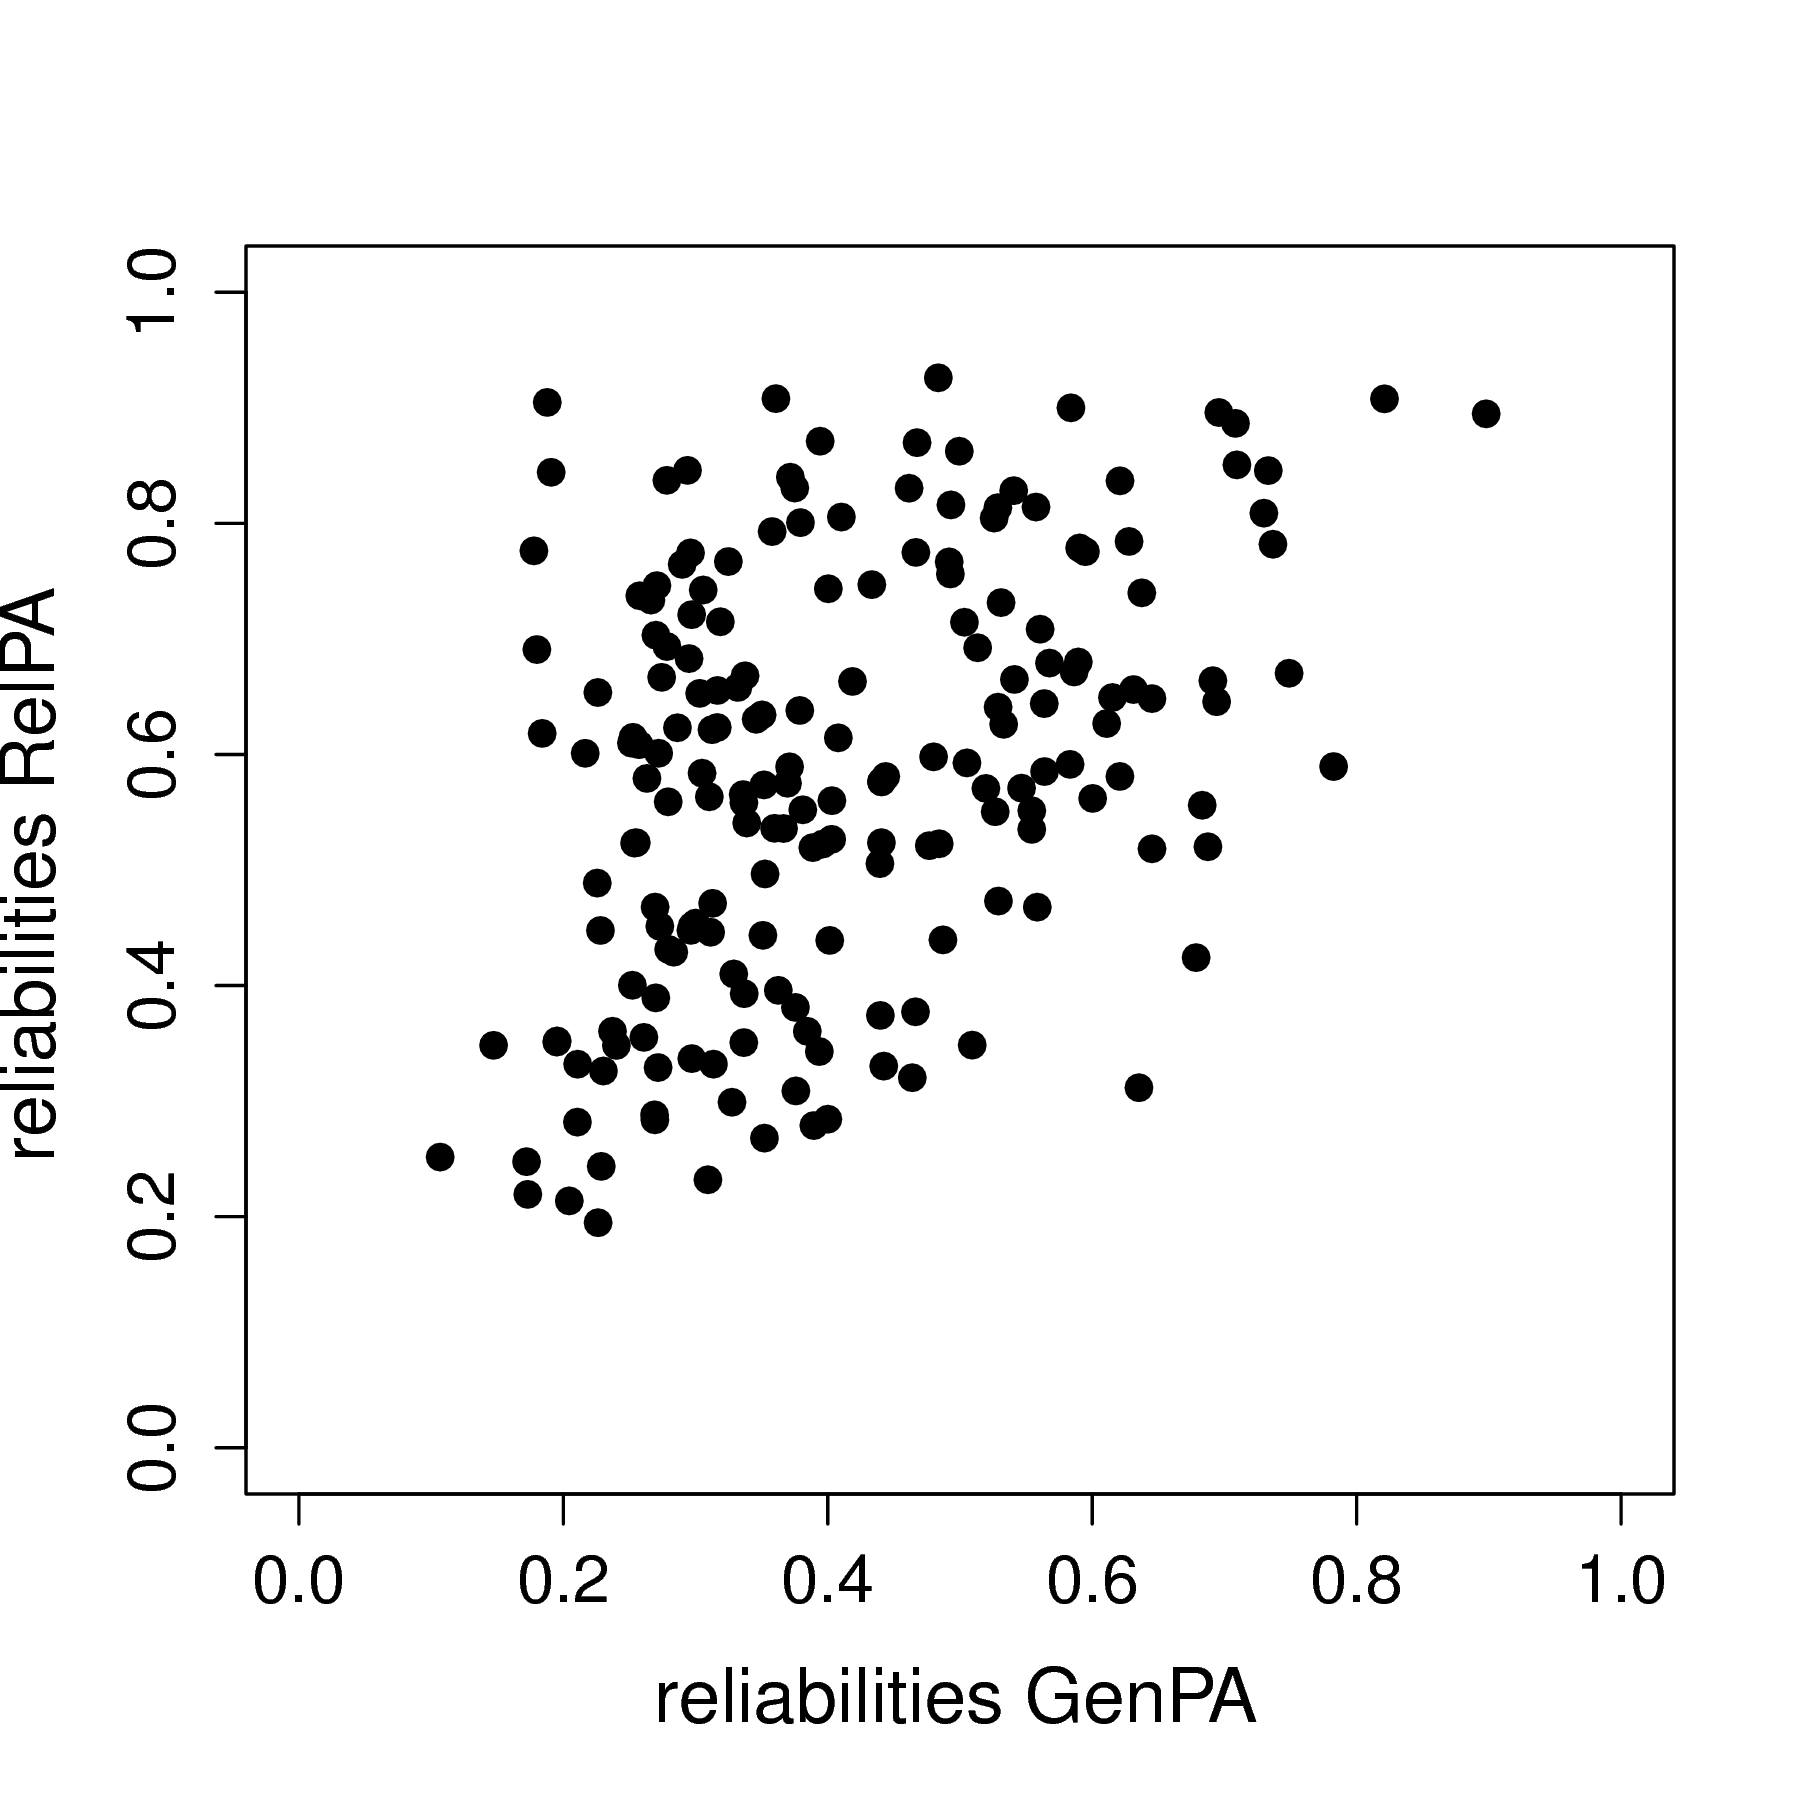
I present a multilevel model that can account for measurement error (MEVAR model) even for a single item, and includes random effects for all parameters, including covariance matrices for the measurement errors and the dynamic errors. This work was published in Psychological Methods (i.e., read more here), for which I implemented this model in Mplus v8. My dissertation includes code for the model in WinBUGS. The model can also be used to obtain a person-specific reliability estimates for each individual in the model. I illustrate this with and empirical example on women's general positive affect and their positive affect specific to their relationship. The scatterplot below shows the modest positive correlation between the person-specific reliabilities for the women's general positive affect (GenPA) and positive affect specific to their relationship (RelPA).
DSEM in Mplus
My work was implemented in the new version 8 of Mplus in 2017, in their Dynamic SEM (DSEM) module . The method I developed for standardization in multilevel VAR models is now the standard method for standardizing Bayesian multilevel (hierarchical) models in Mplus. The (Multilevel or n=1) measurement error models I have worked on are now also available Mplus' DSEM. The Mplus user manual includes examples for these models, and the models are highlighted in Mplus webinars and workshops.
Although I personally have mostly been used to using open source versions of Bayesian software, including winBUGS, JAGS, and STAN, I have been really impressed with the Mplus development of DSEM. It allows for an incredible large range of multilevel dynamic models (extending further than the state space modeling framework), it's very fast, and stable. Here is a snippet from the Mplus website of the possibilities:
" Mplus Version 8, released April 20, 2017, offers two-level, cross-classified, as well as single-level (N=1) time series analysis. In cross-classified analysis the random effects are allowed to vary not only across individuals but also across time to represent time-varying effects.
Mplus can estimate a variety of N=1, two-level and cross-classified time series models. These include univariate autoregressive, regression, cross-lagged, confirmatory factor analysis, Item Response Theory, and structural equation models for continuous, binary, ordered categorical (ordinal), or combinations of these variable types. Bayesian analysis is used in the estimation using a flexible latent variable modeling framework referred to as dynamic structural equation modeling (DSEM). "
More info on DSEM in Mplus here. I've also given some workshops on modeling intensive longitudinal data and DSEM.
Work for the Interdisciplinary Centre of Psychopathology and Emotion Regulation
For the Interdisciplinary Centre of Psychopathology and Emotion Regulation at Groningen University, I performed multiple simulation studies to investigate the model selection and parameter recovery performance of the automated (n=1) VAR modeling procedure (AutovarCore) under ideal circumstances (no violated assumptions), and under the circumstance where the residuals of the VAR model are either skewnormally or truncated normally distributed.
PhD Project: "Multilevel Autoregressive Modeling: Snags and Solutions."
My (recently finished) PhD project focused on further studying/developing/extending multilevel vector autoregressive models (multilevel VAR models), and was supervised by Ellen Hamaker, with Herbert Hoijtink as my promotor. I have worked on the optimal way to standardize the multilevel VAR models, and the optimal way to specify prior(s) for the covariance matrix of the random parameters for the Bayesian estimation of these models. Further, I worked on the incorporation of measurement error in n=1 and multilevel VAR modeling. For more info, see below, or download a copy of my dissertation.
Measurement error in n=1 autoregressive models
Standard AR models disregard that there may be measurement error, or other occasion-specific fluctuations in the observed scores. Disregarding such fluctuations results in (potentially severe) bias in the autoregressive effects. In work together with Jan Houtveen and Ellen Hamaker I present two n=1 autoregressive models that account for such fluctuations (the ARMA model and the MEAR or AR+WN model), and compare their performance in a simulation study, for both a Bayesian and a frequentist estimation procedure.
Studying individual differences in cross-lagged associations by standardizing multilevel VAR models.
Research together with Emilio Ferrer, Mieke de Boer-Sonnenschein, and Ellen Hamaker. We argue the importance of looking beyond just the fixed effects in a multilevel model, and that in order to directly compare cross-lagged coefficients in a multilevel model, these coefficients should be within-person standardized. Supplementary Materials
Inverse-Wishart priors for covariance matrices in multilevel autoregressive models
Research together with Ellen Hamaker and Raoul Grasman. The conjugate prior distribution for the covariance matrix of random parameters in a multilevel (hierarchical) Bayesian model is the Inverse-Wishart matrix. However, for small variances the IW-distribution is very informative (much like its univariate little brother, the Inverse-Gamma distribution, see this paper by Andrew Gelman). For stationary multilevel AR models, the variance of the autoregressive parameters will always be small. We perform a simulation study to compare various IW prior specifications suggested in the literature. Supplementary Materials
Multilevel dynamic factor modeling in BUGS (2011)
For my master thesis in 2011, under supervision of Conor Dolan at the University of Amsterdam (in 2011), I implemented a bivariate multilevel dynamic factor model in winBUGS. The model allows for random means, factor loadings, and autoregressive and cross-lagged coefficients.
Using VAR models to obtain person-specific granger-causal networks (2010)
I was first to connect cross-lagged effects and VAR models to the psychological network approach during my internship with Denny Borsboom
at the University of Amsterdam (in 2010), creating person-specific dynamic network models. This has served as the basis for dynamic
networks in psychology, which have grown increasingly popular. My internship was part of the Psychosystems project, and you can find my report as one of the first items on their publication page (even though it is unpublished).
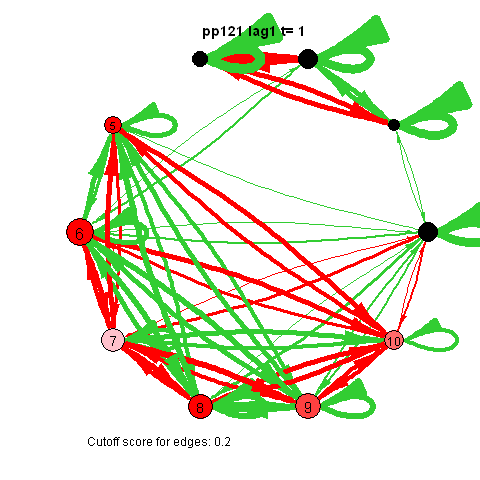
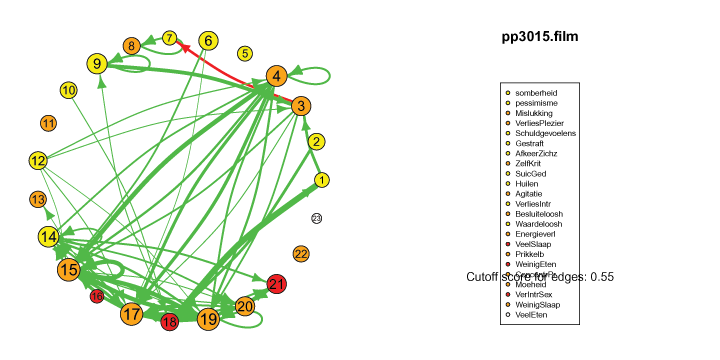
The pics I've included here are some fun pics I found in my old files from the earlier stages of my intership, when I was tinkering around with Qgraph.
The animated gifs are based on real time series data for the symptoms of two different individuals. At this time I used auto- and cross-correlations for the edges in the dynamic networks. I also used VAR models to estimate the lagged relationships between the variables in my internship report, but those (standardized) effects are not depicted in the networks below. The colors of the nodes indicate the height of the score (symptom severity, darker is higher severity), while black nodes indicate a missing observation.
I also came across this "network" representation of the lag 1 (first column of edges) lag 2 (second column of edges) and lag 3 (third column of edges) auto- and cross-correlations for three variables (pink, purple, blue) of an individual:
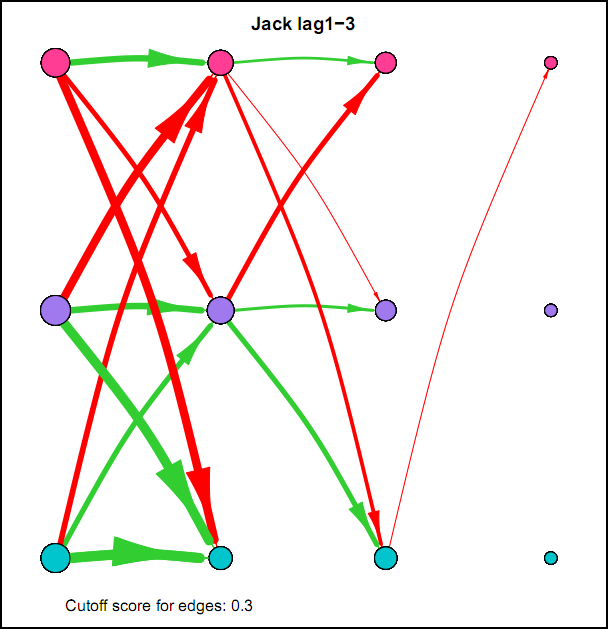
Robert Hillen came up with this format, but I remember being more enthousiastic about it than himself at the time. This representation for multiple lags wasn't picked up in the community, probably for the same reason Robert was less enthousiastic. I think because A) it is not super intuitive, because you shouldn't actually take the complete picture as one big network, but consider each particular column of edges as one dynamic network for a specific lag, and B) as of yet, people tend to focus on only lag 1 coefficients.
However, I actually think it's quite nice: Typically when people are looking at descriptives for time series they have to look at separate cross-correlation plots for two variables at once, and per variable for autocorrelation plots, which is a pain. With this representation you can see in a single image all the auto- and cross-correlations for multiple lags at once.